In order to ensure the stable operation of solar power generation, it is important to monitor the power generation status and detect problems as early as possible. For this purpose, the introduction of a remote monitoring system is indispensable.L-eye, a remote monitoring system and service that supports a wide range of applications from low-voltage to ultra-high-voltage, is easy to install and enables full-scale monitoring, providing strong support for the power generation business.
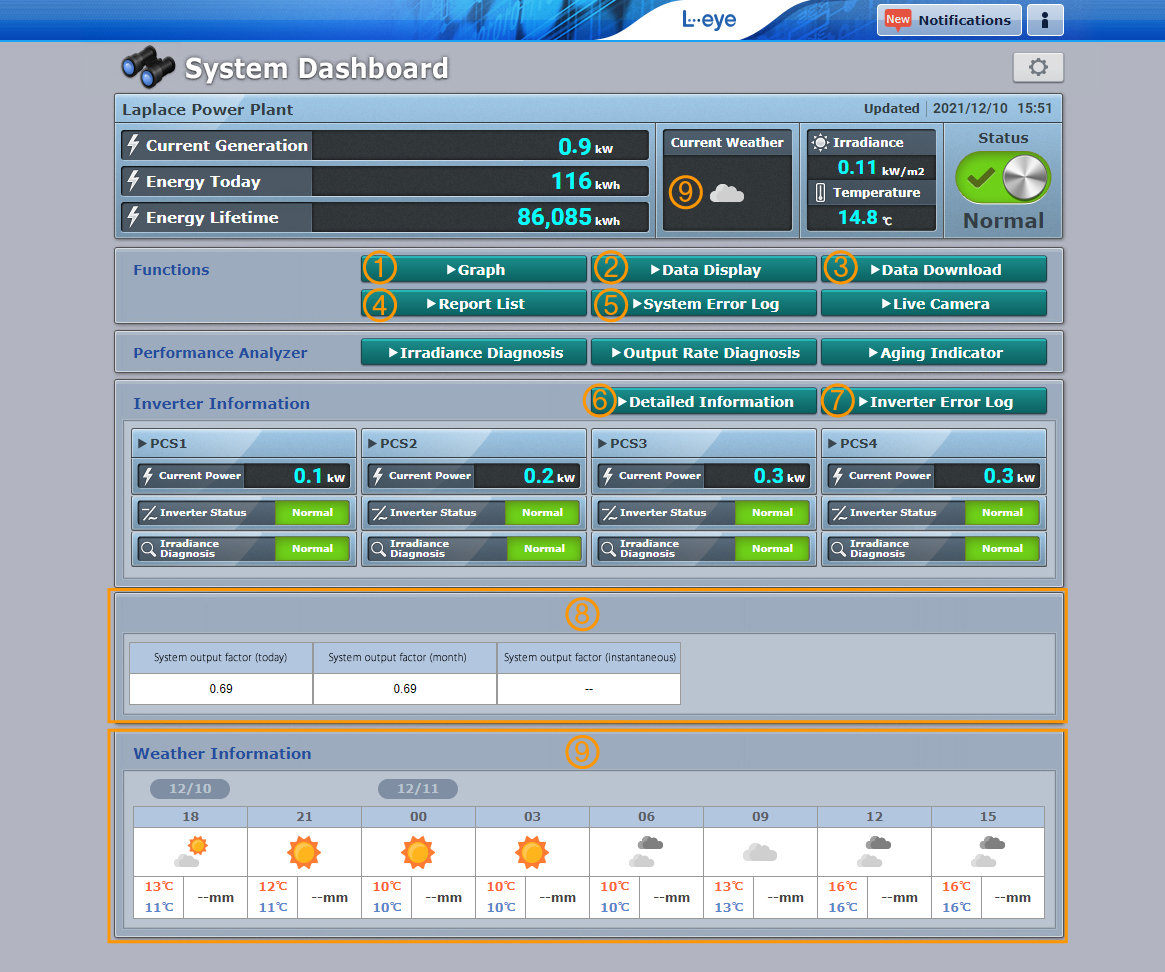
■ Basic Functions
-
1. Graph
The display of the transition of the generated power can be switched according to the measurement item and content. -
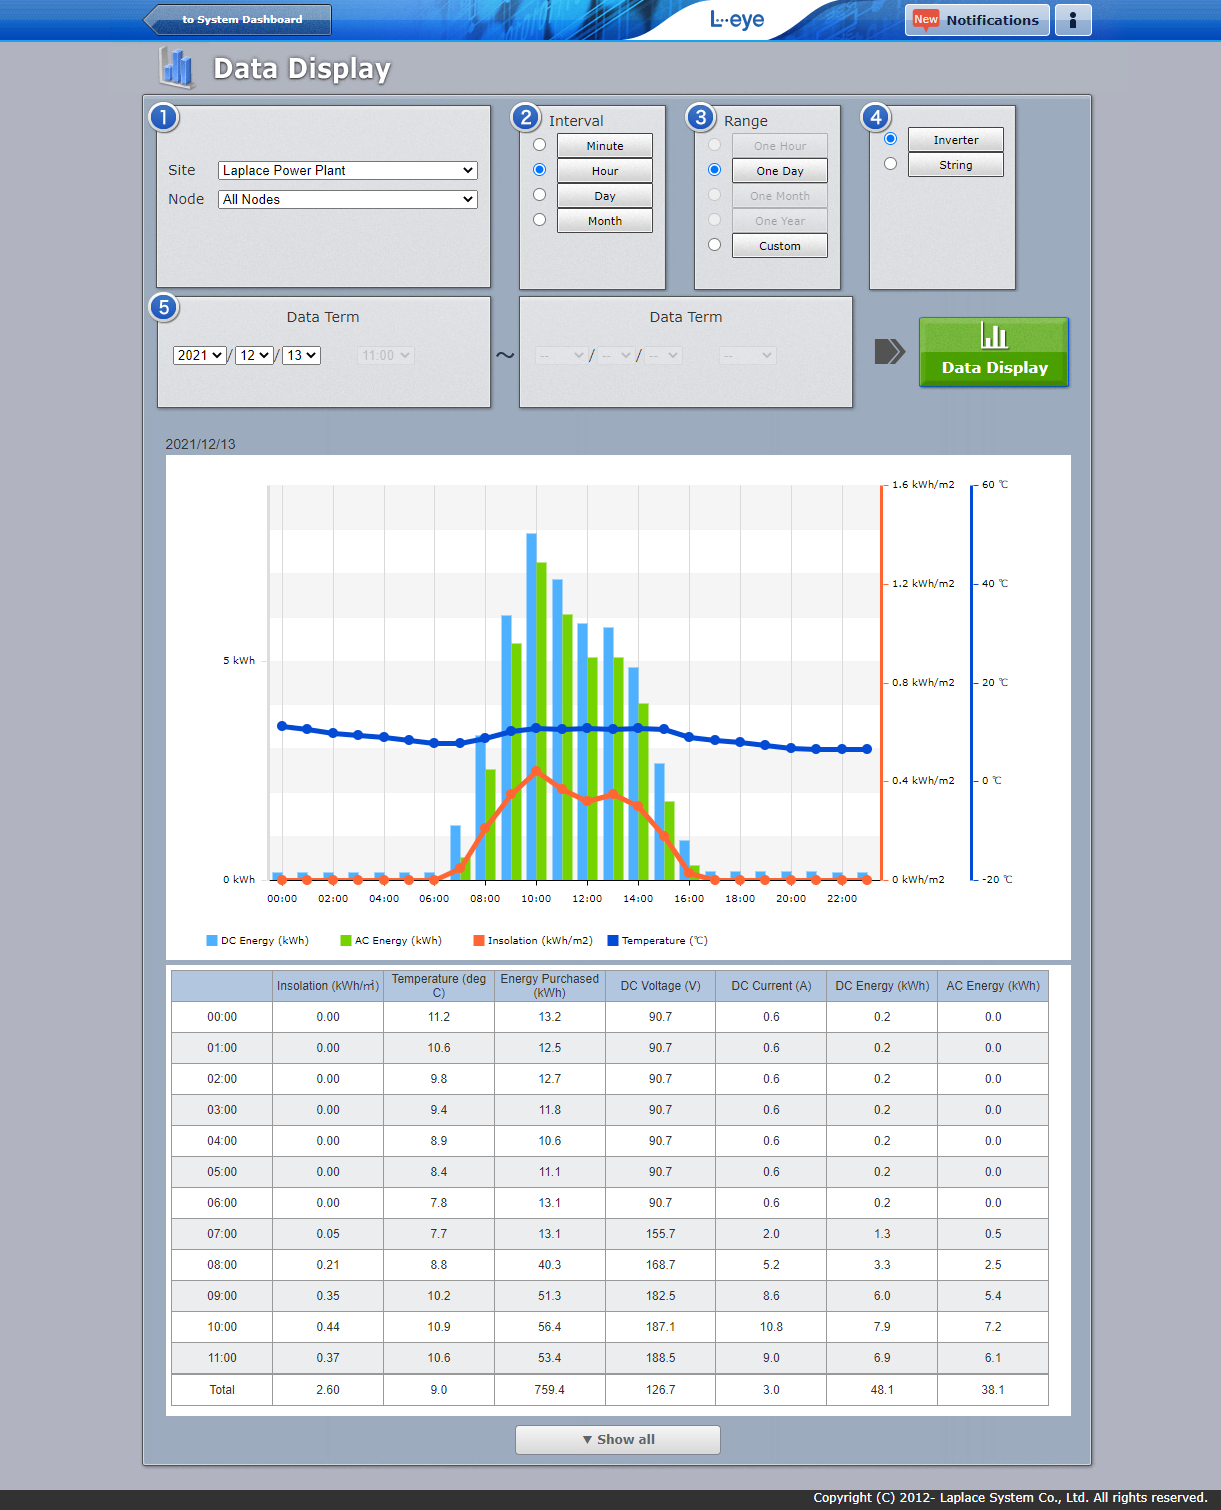
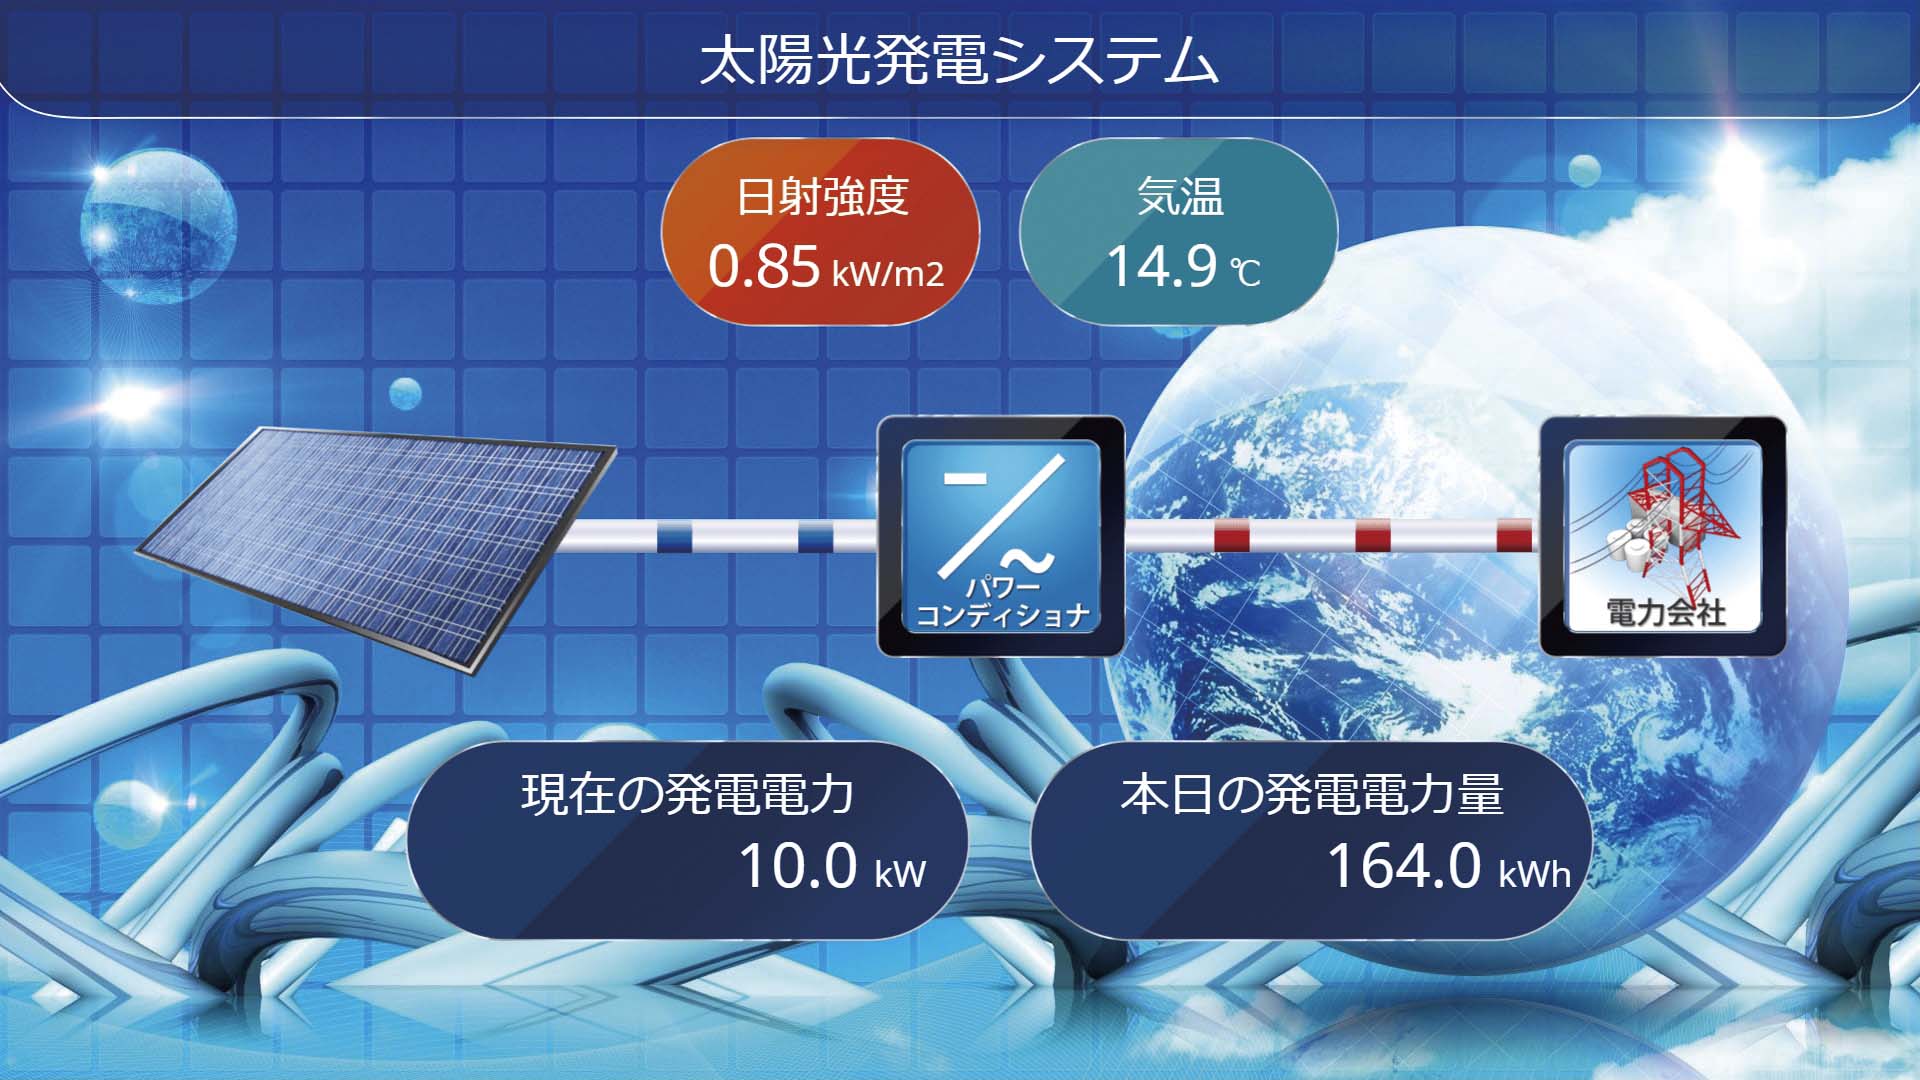
2. Data Display
Data such as power generation, solar radiation, and temperature can be checked in graphs and reports. -
3. Data Download
Measurement data can be downloaded in CSV format. -
4. Record List
You can register the information necessary to run the site.This is useful for maintenance implementation records, etc. -
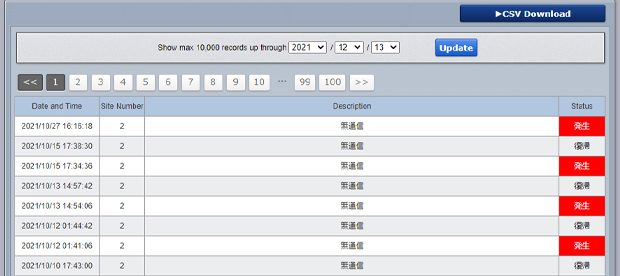
5. System Error Log.
The history of failures and recoveries between the measurement device and the server can be checked and downloaded in CSV format. -
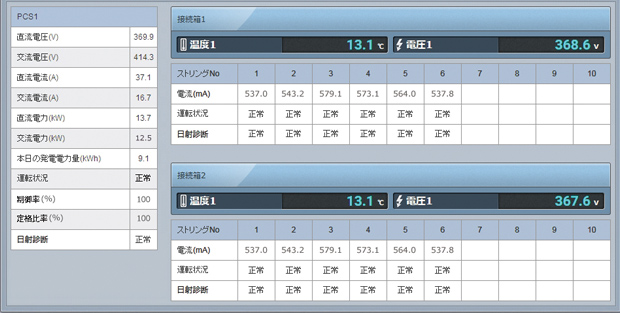
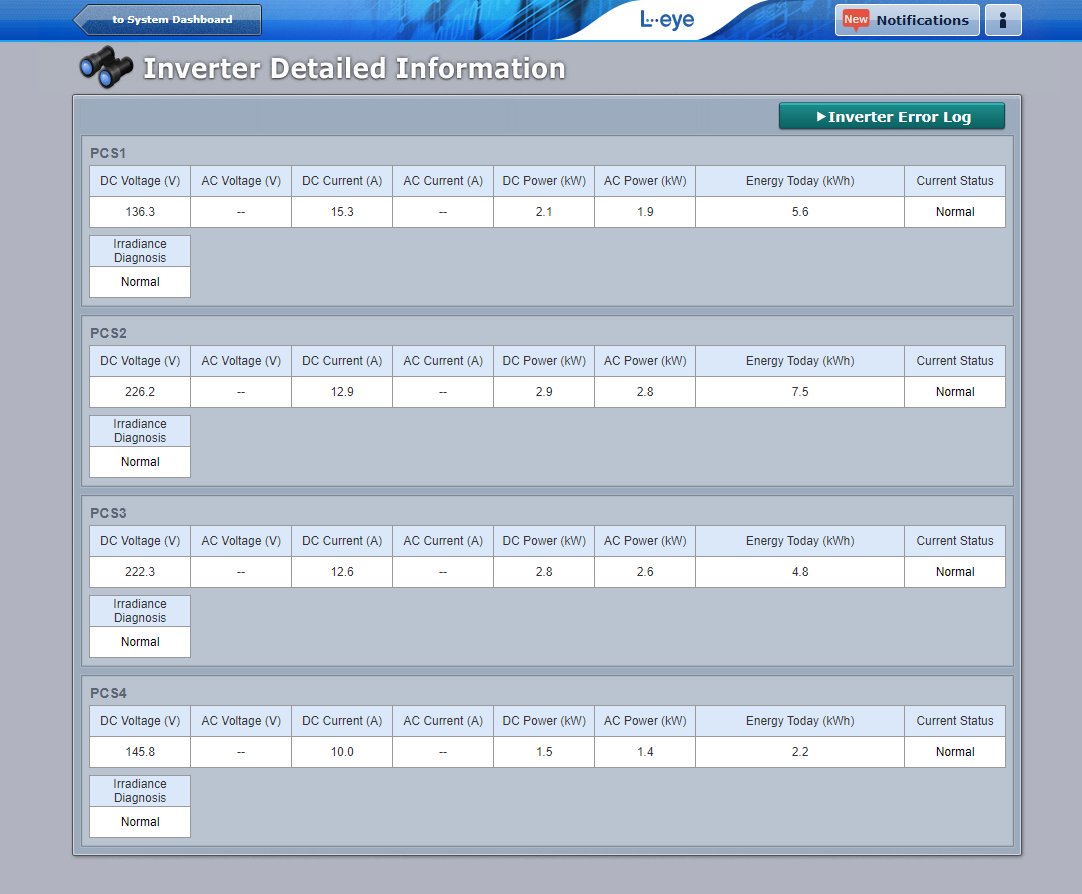
6. Inverter Detailed Information
Displays the current values of voltage, current, and power of each PCS, the daily total value of generated power, and the operation status. -
7. Inverter Error Log
You can check the detailed failure occurrence and recovery history of PCS and download it in CSV format.
It can also notify you by email if the PCS fails. -
8. Flex Area
You can add or delete measurements you want to display, or change the layout. -
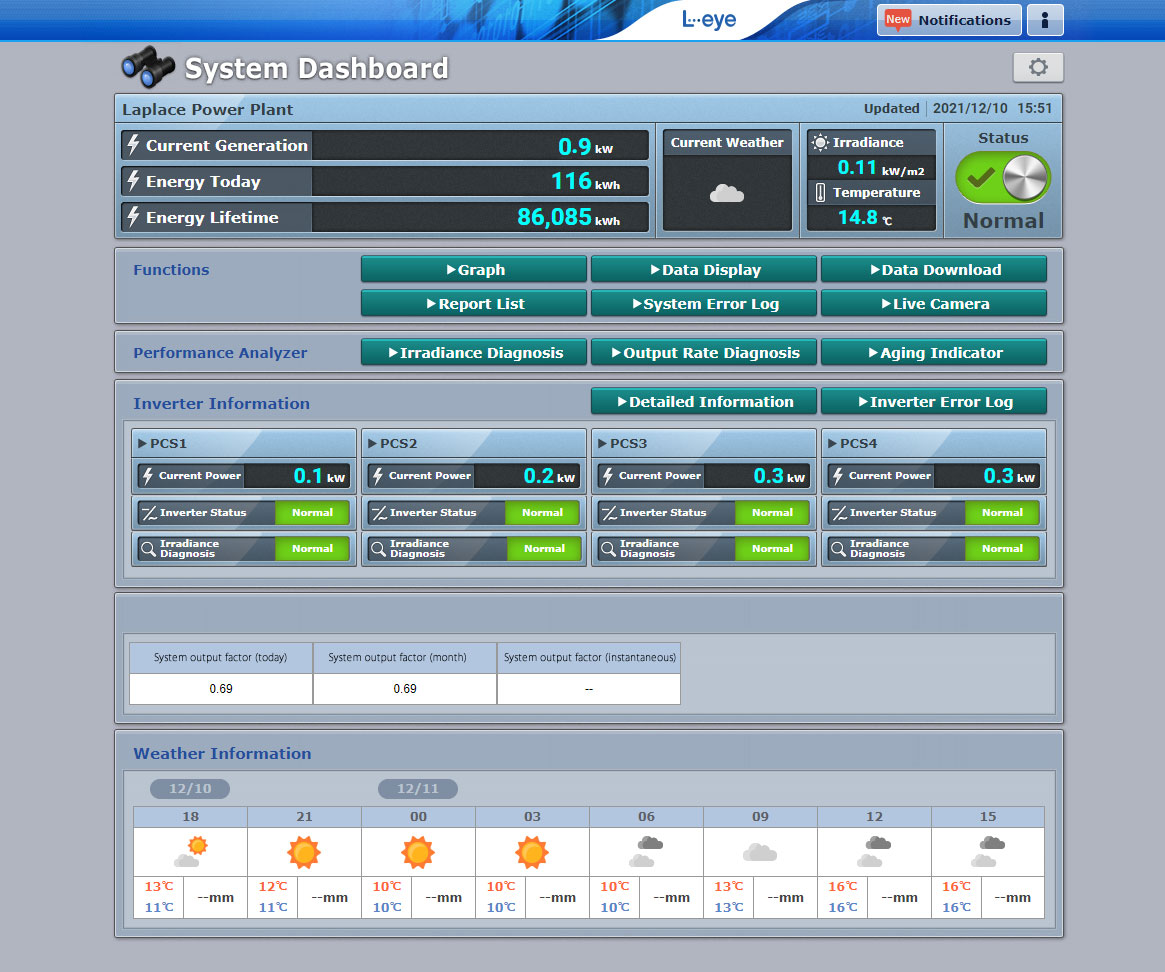
9. Weather Information
You can see the current weather conditions and the weather forecast (today and the next day).
*You will need to configure the settings on your end.
*Please note that this service may not be available on some sites. -
■ Change-over Function
Three new patterns have been added to the design of the monitoring screen.
You can choose the design you like and set it freely.
*You will need to obtain a Laplace ID.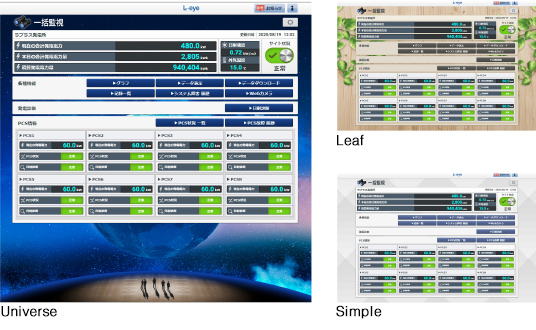
■ Optional Functions
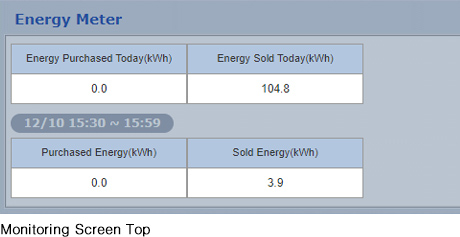
Energy Meter (Measured Value)
It displays information obtained from smart meters and certified electricity meters.The data can also be downloaded in CSV format.
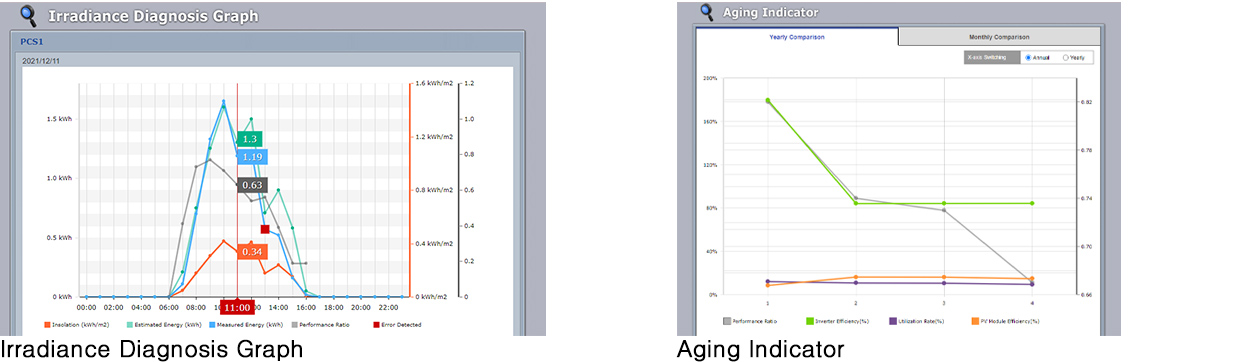
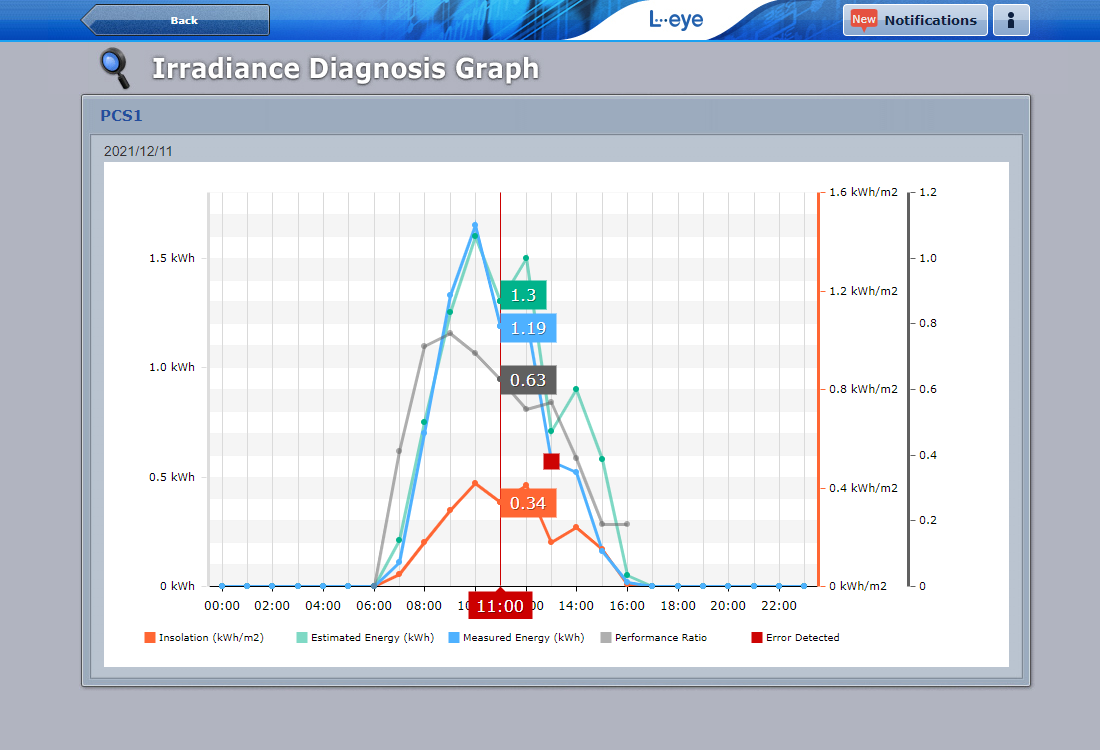
Power Generation Diagnosis
It detects abnormalities through multiple diagnostics, such as whether power is being generated according to the amount of solar radiation or according to the output ratio of each PCS/string to the total amount of power generated.
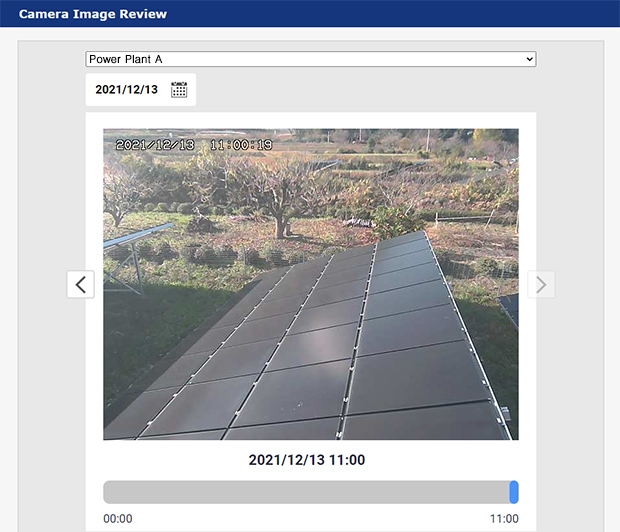
Camera Image Review
By storing the acquired images for 31 days, you can go back in time to check the situation at the site.
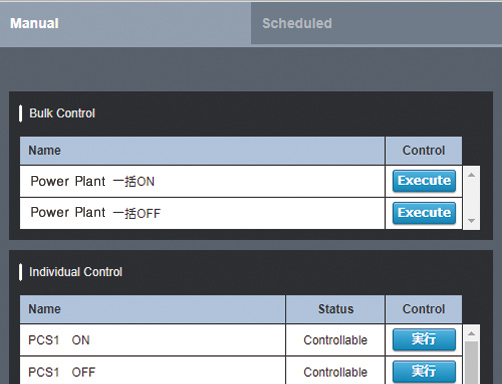
Remote Control
The inverter can be switched on and off remotely via the measurement device.
AC Distribution
AC Distribution Panel information can be displayed on the System Dashboard. Error Logging and email alerts can be enabled for the AC Panel equipment and devices.
String-level Monitoring
String-level summary and detailed information, as well as error status are shown. Detailed string data can be downloaded.
Group Monitoring
Several monitoring sites can be grouped together and monitored as a group.* Several group screens can be grouped together into an upper-level group and sorted.
API
You can easily obtain measurement data and use the data to create your own applications.*By entering a predetermined URL and sending a request to our server, data in XML format will be returned as a response.
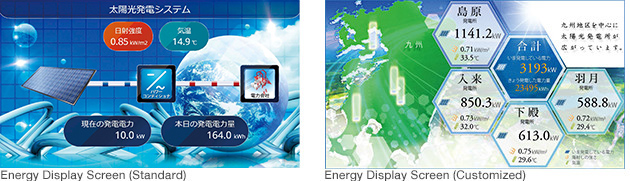
Mieruka Web
"Mieruka Web" allows you to widely promote your environmental contributions with a web browser.Information such as measurement data and power generation systems are represented as PR screens, and display settings can be made with simple operations.
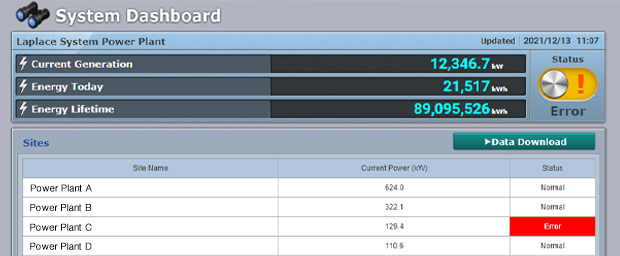
System Dashboard
PC
| * We offer no operation guarantee under other environments. | |
|---|---|
| Supported Operating Systems | Windows 10 |
| Supported Browsers | Google Chrome / Mozilla Firefox / Microsoft Edge(Both are the latest versions) *The graph screen may not be displayed correctly in browsers other than those listed above. |
| Image Resolution | 1280 x 1024 pixels or higher is recommended. (Can also be used with 1024 x 768 pixels) |
Smartphones/Tablets
| *Operation has been confirmed under the following conditions. Operation may differ from that of a PC even in the confirmed environment.The operation of optional functions other than the remote control function has not been confirmed. Please be aware of this. | |
|---|---|
| iPhone / iPad | iOS12: Safari latest version (As of November 2020, only iPhone XR and iPad Air are confirmed to work.) |
| Android | Android9: Google Chrome latest version (As of November 2020, only Google Pixel 3 is confirmed to work.) |